Your company's work,
transformed with DataCraft
Follow how teams build a system by describing it, bring over their spreadsheets, and connect the field and AI — one workflow at a time.
Companies, people and numbers are fictional examples, and screens may differ slightly from the actual product.
Project management
Bridge Design · Design agency · 12 people
Schedules lived in spreadsheets, requests in chat, and status updates only in meetings. When deadlines overlapped, nobody could see who was doing what.
- STEP 01Craft AI Builder
Ask for the system in plain words
The team lead tells Craft AI what they need. It shows the data and pages it will create on a plan card first; approve it and the whole system — menu included — is built.
datacraft.ai.krDataCraft AIAAdminCEOHome > Project management > ProjectsCraft AIPageSystemHTMLBuild a client project management system. Track tasks, owners, due dates and progress per project, and give me a weekly overview.Plan card · Project management- ProjectsClient · period · budget · status
- Task boardTo do → Doing → Review → Done
- TimelineProject periods on a timeline
- DashboardProgress · due soon · tasks by owner
ProjectsTasksClientsOwnersEditApprove & buildDescribe the screen you want - STEP 02Excel import
Bring over the spreadsheet you already use
Pick your existing project spreadsheet in the Data Connection Tool at the top, and it becomes a database exactly as it was. Keep working on it under Library › Imported data — no retyping.
datacraft.ai.krDataCraft AIAAdminCEOHome > Project management > ProjectsData Connection ToolImport fromExcel fileCSV fileFile Tables Rows 2026_projects.xlsx 2 86 Result: Library › Imported dataImport - STEP 03Kanban board
Move tasks across the board
Everyone drags their task cards to the right stage, so the whole team sees the same picture — no more status questions in meetings.
datacraft.ai.krDataCraft AIAAdminCEOHome > Project management > Task boardTask board
To do 211/10 ~ 11/24SeoyeonCatalog cover drafts0%11/2411/07 ~ 11/21HaneulBooth lighting quote0%11/21Doing 211/06 ~ 11/20JunhoLogo guidelines60%11/2011/08 ~ 11/22YunaApp home screen40%11/22Review 111/05 ~ 11/19Seoyeon3 package drafts90%11/19Done 211/02 ~ 11/14JunhoBrand colors100%11/1411/02 ~ 11/14HaneulBooth plan v1100%11/14 - STEP 04Timeline
Every project schedule on one screen
Project periods and progress are drawn on a timeline. Overlapping deadlines stand out, so staffing can be adjusted early.
datacraft.ai.krDataCraft AIAAdminCEOHome > Project management > Project timelineProject timeline (Oct 2026 – Jan 2027)
ProjectsOctNovDecJanRebranding BXRebranding BX55%App UI refreshApp UI refresh45%Expo boothExpo booth70%Annual catalogAnnual catalog15% - STEP 05Craft AI Report
Weekly reports write themselves
Every Friday the weekly report is built from task data — numbers, charts and an AI summary — and goes straight to the CEO for approval.
datacraft.ai.krDataCraft AIAAdminCEOHome > Project management > Weekly reportData Purpose Template & style AI draft5 Refine & saveWeekly project report · Nov week 3Nov 16–20, 2026 · 4 active projectsTasks done14▲ 3 vs last weekAvg. progress46%▲ 9 ptsDue soon2By this FridayAI summaryThe expo booth project is in review and on track for its 11/28 deadline. The app UI refresh still has the home screen left and needs extra hands next week.
ApprovalDrafted · SeoyeonApprove · CEO
- Fewer status meetings
- Deadline clashes spotted early
- No more hand-written weekly reports
Inventory management
Green Market · Food distributor · 25 people
Over 300 items, tracked only in one person's spreadsheet. Shortages were discovered after orders came in — again and again.
- STEP 01Craft AI Builder
Describe the inventory system
The purchasing manager explains how they want to track stock. Safety-stock rules and stock value calculations go into the plan card too.
datacraft.ai.krDataCraft AIAAdminCEOHome > Inventory management > ItemsCraft AIPageSystemHTMLBuild a food inventory system. Track current and safety stock per item, flag shortages right away, and calculate stock value automatically.Plan card · Inventory management- ItemsItem · category · unit · price · supplier
- Stock levelsOn hand · safety stock · shortage (auto)
- Stock countMobile stock counting
- DashboardStock value · shortages · by category
ItemsStockCountsSuppliersFormula: value = qty × priceEditApprove & buildDescribe the screen you want - STEP 02Column automation · formulas
Shortages flag themselves
When on-hand stock drops below safety stock, column automation sets the status to “Low,” and a formula column calculates stock value as quantity × price. No manual math.
datacraft.ai.krDataCraft AIAAdminCEOHome > Inventory management > Stock levelsStock levels
Show low onlySearchNo Item Category On hand Safety Value Status 1 Onions (20 kg) Veg 8 15 $198 Low 2 Garlic (1 kg) Veg 42 30 $394 OK 3 Olive oil (18 L) Oil 6 5 $405 Watch 4 Flour (20 kg) Grain 31 20 $535 OK 5 Butter (450 g) Dairy 12 24 $88 Low 5 rowsAdd row - STEP 03Craft AI Biz Tools
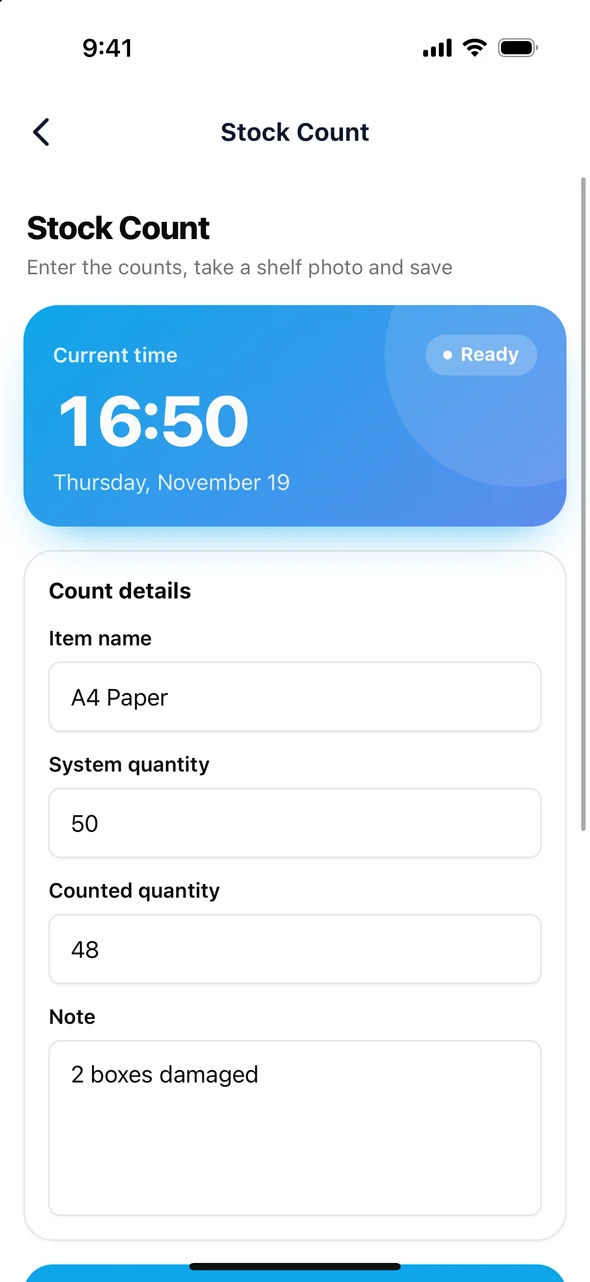
Count stock on a phone in the warehouse
Warehouse staff enter counts with a Biz Tool in the DataCraft app. Entries are allowed only within the warehouse radius and update stock levels instantly.
- STEP 04Dashboard
Stock status at a glance
Stock value, shortages and category mix come together on a dashboard. The CEO and purchasing look at the same numbers to decide orders.
datacraft.ai.krDataCraft AIAAdminCEOHome > Inventory management > DashboardInventory dashboard
Total stock value$36.2KLow items7Items tracked312Counts this month4Stock value by category ($K)VegMeatGrainOilDairyOtherStock status312- OK85.9%
- Watch11.9%
- Low2.2%
- STEP 05Craft AI Messenger
Order talk becomes to-dos
AI finds order requests in the purchasing team's chat and turns them into to-dos. One tap adds them to the order board.
datacraft.ai.krDataCraft AIAAdminCEOHome > Inventory management > SuppliersPurchasingCChangminOnions are low. We need 20 boxes by Thursday morning.SSoheeButter too. I'll order it by Friday.Great, I'll track it!To-dos found in chatAdd to order boardOrder 20 boxes of onionsThu 11/26, morning · ChangminOrder butterFri 11/27 · Sohee
- Shortages spotted before orders
- Counts hit the system instantly
- Stock value calculated for you
Inbound & outbound
Hanbit Logistics · 3PL warehouse · 40 people
Inbound notices by email, outbound requests by phone, results in paper logs. When a client asked “where are we?”, someone had to call the warehouse.
- STEP 01Craft AI Builder
Ask for an inbound/outbound system
The operations lead describes the flow; schedule, movement log and on-site entry screens are designed as one system.
datacraft.ai.krDataCraft AIAAdminCEOHome > Inbound & outbound > ScheduleCraft AIPageSystemHTMLBuild an inbound/outbound system. Show schedules on a calendar, track status as waiting, in progress and done, and let floor staff register on their phones.Plan card · Inbound & outbound- ScheduleInbound/outbound calendar
- MovementsNo. · type · item · qty · status
- On-site entryMobile receiving & shipping tool
- StatusCompletion · counts by type · daily trend
MovementsItemsClientsLocationsEditApprove & buildDescribe the screen you want - STEP 02Calendar
This month's schedule on a calendar
Inbound and outbound appear in different colors. Busy days are visible in advance so staff can be assigned.
datacraft.ai.krDataCraft AIAAdminCEOHome > Inbound & outbound > ScheduleSchedule
November 2026TodaySunMonTueWedThuFriSat123IN · Hangyul45OUT · Moa678910IN · Daesung1112OUT · GreenIN · Moa1314151617OUT · Hangyul1819IN · Green2021222324OUT · Daesung2526IN · Hangyul27282930November 12, 20262 event(s)AddOUT · GreenIN · Moa - STEP 03Craft AI Biz Tools
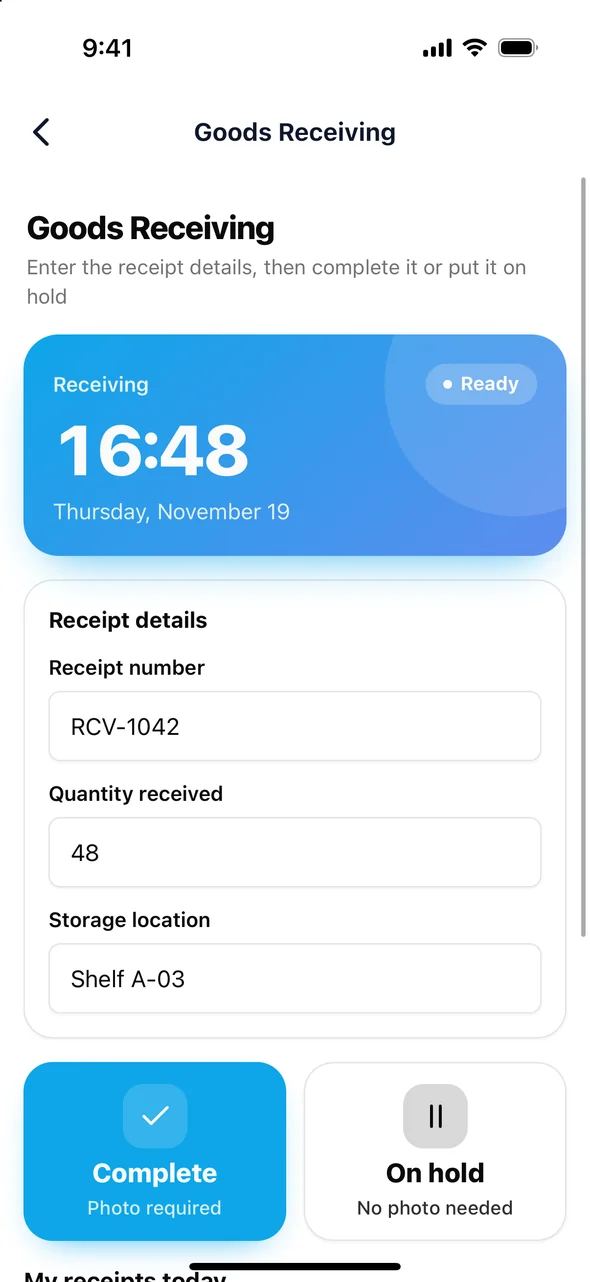
Floor staff process on their phones
Staff check arrivals and record quantity and photos. One button sets the status to “Done,” with time and handler recorded.
- STEP 04Table
Every movement in one table
Who handled what, when and how many — all in one table. Client questions are answered by looking at the screen.
datacraft.ai.krDataCraft AIAAdminCEOHome > Inbound & outbound > MovementsMovements
AllSearchNo No. Type Client Item Qty Status By 1 IN-1119-03 IN Green Market Dumplings 118 Done TTaeyun 2 OUT-1119-07 OUT Moa Beauty Skin set 340 In progress JJimin 3 IN-1119-04 IN Daesung Bearing parts 60 Waiting - 4 OUT-1119-08 OUT Hangyul 6 sauces 95 Done TTaeyun 5 IN-1119-05 IN Hangyul Containers 500 Waiting - 5 rowsAdd row - STEP 05Dashboard
Live inbound/outbound status
Today's completion rate and the daily trend update as work is recorded. Backlogs show up as numbers.
datacraft.ai.krDataCraft AIAAdminCEOHome > Inbound & outbound > StatusStatus
Completed today082%100Inbound today14Outbound today21Waiting6Daily movementsInboundOutbound11/1311/1411/1711/1811/19Status39- Done74.4%
- In progress10.3%
- Waiting15.4%
- No paper logs — recorded on the spot
- Client questions answered from the screen
- Busy days planned ahead
Accounting
Onsaemiro Café · 3 café branches · 18 people
Each branch kept its own sales and expense spreadsheet, and HQ merged them at month-end. One closing report took three days.
- STEP 01Craft AI Builder
Ask for a branch accounting system
The HQ manager explains how branch sales and expenses should be tracked. Account codes, branches and P&L calculations go into the plan.
datacraft.ai.krDataCraft AIAAdminCEOHome > Accounting > SalesCraft AIPageSystemHTMLBuild an accounting system for our 3 café branches. Track sales and expenses by branch and account, and show monthly profit and loss at a glance.Plan card · Branch accounting- SalesDate · branch · payment · amount
- ExpensesDate · branch · account · vendor · amount
- Monthly P&LSales · expenses · profit (auto)
- Month-end closeClosing report · approval
SalesExpensesBranchesAccountsVendorsEditApprove & buildDescribe the screen you want - STEP 02Excel import
Every branch's files in one place
Import each branch's expense spreadsheet and card statement CSV with the Data Connection Tool. Each table becomes a database, so scattered numbers live in one place.
datacraft.ai.krDataCraft AIAAdminCEOHome > Accounting > ExpensesData Connection ToolImport fromExcel fileCSV fileFile Tables Rows Nov_expenses_Seongsu.xlsx 1 64 Nov_card_statement.csv 1 212 Result: Library › Imported dataImport - STEP 03Table · totals
Expenses sorted by account automatically
Expenses are organized by branch and account, with totals right in the table summary. Nothing to merge at month-end.
datacraft.ai.krDataCraft AIAAdminCEOHome > Accounting > ExpensesExpenses · November 2026
By branchSearchNo Date Branch Account Vendor Amount Receipt 1 11/02 Seongsu Ingredients Hangyul $930 Attached 2 11/03 Hapjeong Ingredients Hangyul $735 Attached 3 11/05 Seongsu Supplies Green Market $140 Attached 4 11/10 Pangyo Rent Pangyo Tower $3,150 Missing 5 11/14 Hapjeong Utilities KEPCO $283 Attached 5 rowsAdd row - STEP 04Dashboard
Monthly P&L, right there
Sales, expenses and profit per branch are calculated and charted automatically. Rising costs are easy to trace to a branch.
datacraft.ai.krDataCraft AIAAdminCEOHome > Accounting > Monthly P&LMonthly P&L
Nov sales$64.8KNov expenses$46.4KOperating profit$18.4KMissing receipts3Monthly sales · expenses ($K)ExpensesSalesJulAugSepOctNovSales by branch86- Seongsu39.5%
- Hapjeong31.9%
- Pangyo28.6%
- STEP 05Craft AI Report
Your closing template, filled in
Upload the Excel closing template you always use: formatting stays, numbers are filled in. The finished report goes to the tax lead and CEO for approval.
datacraft.ai.krDataCraft AIAAdminCEOHome > Accounting > Month-end closeData Purpose Template & style AI draft5 Refine & saveNovember 2026 month-end closeCompany template (Excel) · 3 branches combinedSales$64.8K▲ 5.5% MoMExpenses$46.4K▲ 3.9%Op. profit$18.4K▲ 9.9%AI summaryHigher sales at Seongsu lifted overall profit. Pangyo has one rent receipt missing, which should be checked before approval.
ApprovalDrafted · HQConsensus · TaxApprove · CEO
- No month-end spreadsheet merging
- P&L checked daily
- Closing reports in your own template
Marketing
Moa Beauty · Cosmetics brand · 30 people
Campaign plans in docs, content in a shared calendar, results in each channel's ad console. Answering “is marketing working this month?” took half a day.
- STEP 01Craft AI Builder
Ask for a marketing operations system
The marketing lead describes everything from campaigns to results. Metrics like ROAS are part of the plan card.
datacraft.ai.krDataCraft AIAAdminCEOHome > Marketing > Campaign boardCraft AIPageSystemHTMLBuild a marketing system. Manage campaigns by stage, and show content schedules plus ad spend, revenue and ROAS per channel in one place.Plan card · Marketing management- Campaign boardPlan → Produce → Live → Done
- Content calendarPublishing schedule by channel
- Channel resultsSpend · revenue · ROAS (auto)
- DashboardMonthly results · channel mix
CampaignsContentChannel resultsFormula: ROAS = revenue ÷ spendEditApprove & buildDescribe the screen you want - STEP 02Kanban board
Campaigns, stage by stage
Campaign cards move from planning to done, with owner and start date on each card.
datacraft.ai.krDataCraft AIAAdminCEOHome > Marketing > Campaign boardCampaign board
Plan 111/17 ~ 12/01AreumHoliday gift set0%12/01Produce 211/11 ~ 11/25MinseokMoisture cream relaunch70%11/2511/14 ~ 11/28JiwooInfluencer reviews30%11/28Live 111/16 ~ 11/30AreumBlack Friday55%11/30Done 211/02 ~ 11/14MinseokFall sun care100%11/1411/02 ~ 11/14JiwooOctober member event100%11/14 - STEP 03Calendar
Content schedule on a calendar
Instagram, blog and YouTube posts appear in channel colors, so gaps and clashes are obvious.
datacraft.ai.krDataCraft AIAAdminCEOHome > Marketing > Content calendarContent calendar
November 2026TodaySunMonTueWedThuFriSat1234IG · teaser56Blog · ingredients7891011YT · routine1213IG · reviews1415161718Blog · winter care1920IG · BF preview2122232425YT · unboxing2627IG · BF launch282930November 4, 20261 event(s)AddIG · teaser - STEP 04Dashboard
Channel results on one screen
Enter spend and revenue per channel; ROAS is calculated and charted automatically. Budget decisions are made with numbers.
datacraft.ai.krDataCraft AIAAdminCEOHome > Marketing > DashboardMarketing dashboard · November
Ad spend$13.9KAd revenue$53.4KAvg. ROAS383%Posts published24Revenue · spend by channel ($K)SpendRevenueIGSearchYouTubeBlogRevenue mix53- IG39.9%
- Search27.7%
- YouTube17.6%
- Blog14.8%
- STEP 05Craft AI Messenger
Meeting chat becomes board tasks
AI finds to-dos, due dates and owners in the marketing team's chat. Picked to-dos are added to the campaign board in one line.
datacraft.ai.krDataCraft AIAAdminCEOHome > Marketing > Meeting to-dosMarketingAAreumPlease send the revised BF product page by Tuesday.MMinseokOn it. Review video edit by Thursday.JJiwooI'll send the influencer contract tomorrow.To-dos found in chatAdd to campaign boardRevise BF product pageTue 11/24 · MinseokEdit review videoThu 11/26 · MinseokSend influencer contractFri 11/20 · Jiwoo
- Campaign status on one board
- Budgets set by channel ROAS
- Meeting to-dos don't get lost
Production
Daesung Precision · Precision parts maker · 60 people
Plans on a whiteboard, output in paper work logs. The welding robots cycle thousands of times a day, but that operating data stayed locked inside their controllers. Comparing plan vs. actual meant typing logs into Excel every weekend.
- STEP 01Craft AI Builder
Ask for a production system
The production lead describes plans, output and defects. Work time and attainment calculations go into the plan card.
datacraft.ai.krDataCraft AIAAdminCEOHome > Production > Production planCraft AIPageSystemHTMLBuild a production management system. Show each line's plan on a schedule, and when workers enter output and defects, calculate attainment against plan automatically.Plan card · Production management- Production planLine schedules on a timeline
- Work ordersOrder no. · item · qty · line
- OutputQty · defects · work time (auto)
- DashboardAttainment · defect rate · by line
PlansWork ordersOutputRobot logsFormula: attainment = actual ÷ planEditApprove & buildDescribe the screen you want - STEP 02Timeline
Line plans on a timeline
What each line makes, and until when, is drawn on a timeline with progress inside each bar.
datacraft.ai.krDataCraft AIAAdminCEOHome > Production > Production planProduction plan · Nov week 4
JobsMonTueWedThuFriL1 · bearing housingL1 · bearing housing70%L2 · shaft AL2 · shaft A40%L3 · flangeL3 · flange10%L1 · cover plateL1 · cover plate0% - STEP 03Craft AI Biz Tools
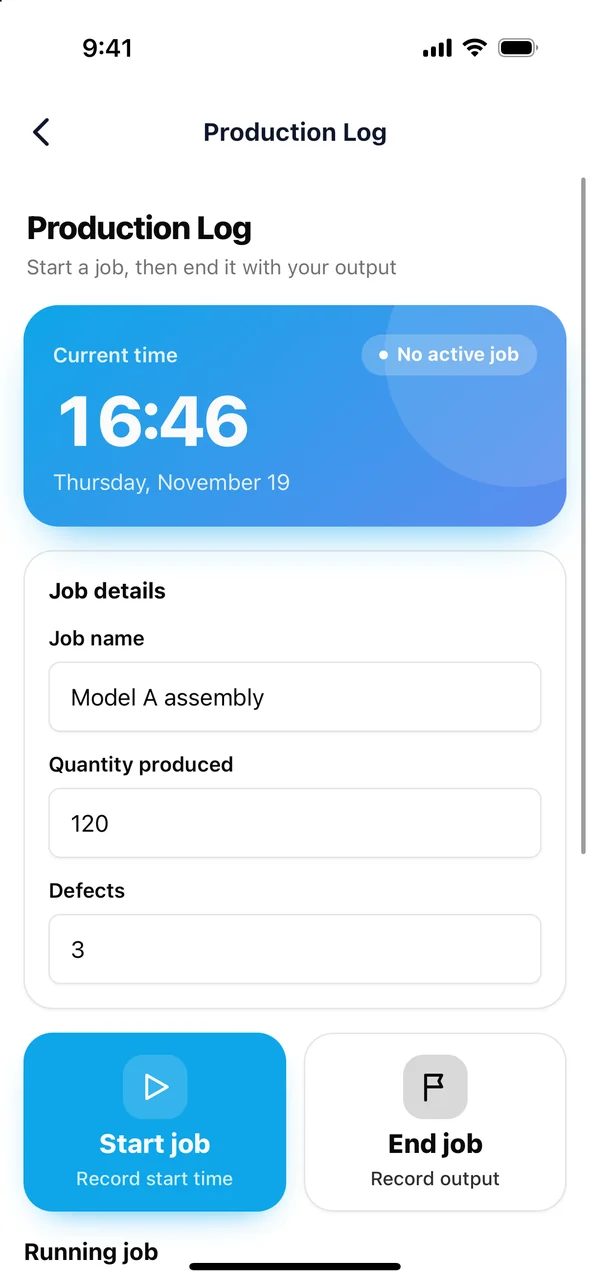
Workers log output with a button
Workers tap start and finish in a Biz Tool and enter quantity and defects. Work time is calculated automatically.
- STEP 04DataLink Studio · Craft Edge
Craft Edge collects welding robot data
Upload the robot controller's communication manual to DataLink Studio; AI proposes how to read the data, and the approved definition becomes an Edge tool. A Craft Edge gateway beside the robot cell reads run state, cycle time, output and alarms over RS-485, shows them live and records each row.
✕Welding robot cell #2Last received 14:02:31Run stateRUNCycle time42.6sTotal output1,284pcsAxis 1 load68%AlarmOK3,842 frames received · 312 rows sent · 0 unknown · 0 missedReceived State Cycle Output Alarm 14:02:31 RUN 42.6s 1,284 OK 14:01:48 RUN 42.9s 1,283 OK 14:01:05 RUN 42.4s 1,282 OK 14:00:22 RUN 43.1s 1,281 OK - STEP 05Dashboard
Plan vs. actual, every day
As worker entries and robot records accumulate, attainment and defect rates update on the dashboard. No weekend data entry.
datacraft.ai.krDataCraft AIAAdminCEOHome > Production > DashboardProduction dashboard · Nov week 4
Attainment091%100Output this week3,840Defect rate1.2%Delayed jobs1Plan · actual by linePlanActualLine 1Line 2Line 3Defect types46- Dimension45.7%
- Surface30.4%
- Other23.9%
- No retyping work logs
- Robot data collected automatically
- Plan vs. actual checked daily
OKR performance
NextWave · B2B SaaS startup · 45 people
OKRs set at the start of the quarter stayed in a slide deck, and progress was checked only at quarter-end. Each team used its own doc, so nobody knew where company goals stood.
- STEP 01Craft AI Builder
Describe your OKR system
The operations team explains how OKRs should run. Key results sit under each objective, and their progress rolls up into objective attainment automatically.
datacraft.ai.krDataCraft AIAAdminCEOHome > OKR performance > ObjectivesCraft AIPageSystemHTMLBuild an OKR system. Put key results under company and team objectives, and when people update current values in a weekly check-in, calculate objective attainment automatically.Plan card · OKR performance- ObjectivesObjective · team · owner · attainment (KR roll-up)
- Key resultsStart · target · current · progress (auto)
- Check-inMobile: current value · confidence · note
- DashboardAttainment by team · at-risk KRs
ObjectivesKey resultsCheck-insTeamsFormula: progress · child averageEditApprove & buildDescribe the screen you want - STEP 02Table · roll-up
Objectives and key results in one table
When a key result's current value changes, progress is recalculated, and the objective's attainment updates as the average of its key results.
datacraft.ai.krDataCraft AIAAdminCEOHome > OKR performance > Key resultsQ4 2026 key results
By teamSearchNo Objective Key result Target Current Progress Status 1 Grow new customers Paying companies 120 86 72% On track 2 Grow new customers Free trial sign-ups 1,500 1,240 83% On track 3 Improve retention Monthly churn 2.0% 2.6% 40% At risk 4 Improve retention NPS 50 44 65% Watch 5 Product stability Incident-free weeks 12 9 75% On track 5 rowsAdd row - STEP 03Craft AI Biz Tools
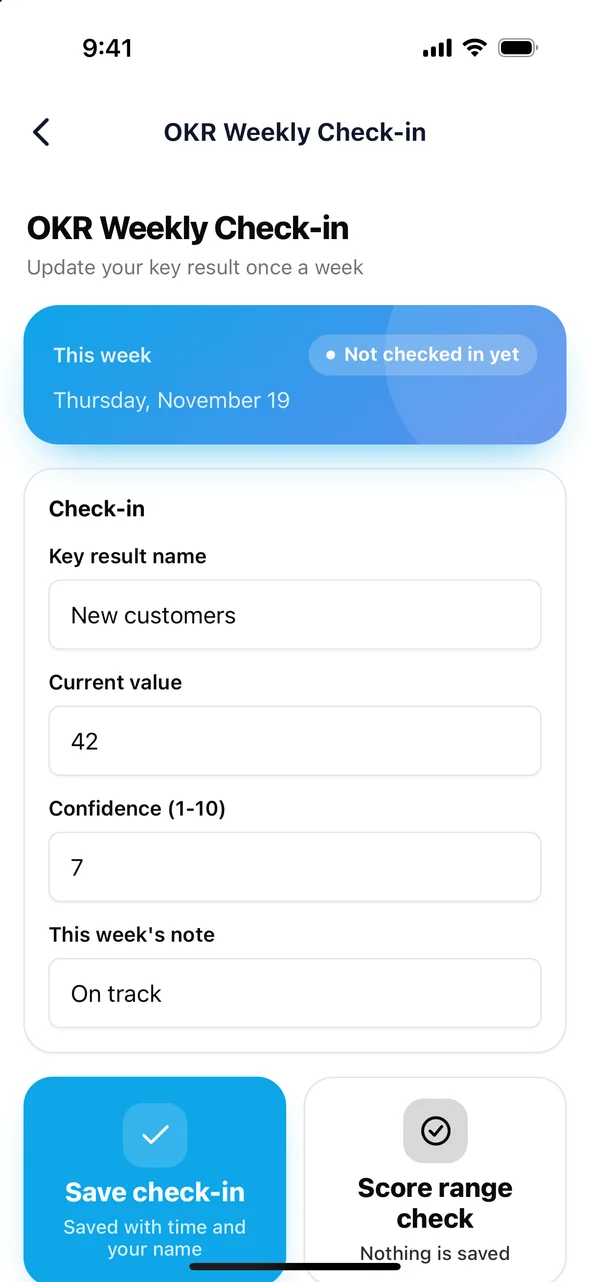
Friday check-ins from a phone
KR owners log this week's value, confidence and a one-line note in a Biz Tool. Progress and attainment update the moment it's saved.
- STEP 04Dashboard
Where company OKRs stand right now
Team attainment and at-risk key results come together on a dashboard — reviewed in every weekly leadership meeting, not just at quarter-end.
datacraft.ai.krDataCraft AIAAdminCEOHome > OKR performance > OKR dashboardOKR dashboard · Q4 2026
Company attainment068%100Quarter elapsed8 / 13 wksAt-risk KRs2Check-ins this week94%Attainment by team (%)SalesMarketingCSProductEngKR status21- On track66.7%
- Watch23.8%
- At risk9.5%
- STEP 05Craft AI Report
Quarterly reviews from check-in history
At quarter-end the OKR review is built from check-ins and notes. AI reads the notes, summarizes what worked and what got stuck, and it goes to the CEO for approval.
datacraft.ai.krDataCraft AIAAdminCEOHome > OKR performance > Quarterly reviewData Purpose Template & style AI draft5 Refine & saveQ4 2026 OKR review3 objectives · 21 key results · 268 check-insAttainment68%▲ 11 pts vs Q3KRs achieved970%+ attainedCheck-in rate94%▲ 8 ptsAI summaryWebinar lead conversion keeps the new-customer objective on track. Notes about onboarding delays recur under churn — worth carrying into next quarter's CS objective.
ApprovalDrafted · OpsApprove · CEO
- OKR progress checked weekly
- Attainment rolls up automatically
- Quarterly reviews written from check-ins
HR management
Onnuri Tech · IT services · 85 people
The employee roster lived in HR's spreadsheet, attendance on a paper sheet, and leave requests in chat. Summarizing leave usage at year-end meant reconciling three sources.
- STEP 01Craft AI Builder
Describe your HR system
The HR manager explains what to track. Employee roster, attendance, leave and dashboard screens go onto one plan card; approve it and the whole system, menu included, is built.
datacraft.ai.krDataCraft AIAAdminCEOHome > HR management > EmployeesCraft AIPageSystemHTMLBuild an HR system. Track the employee roster, attendance, leave requests and a leave calendar, and show headcount by department and leave usage at a glance.Plan card · HR management- EmployeesName · department · title · hire date · type
- AttendanceDate · in · out · hours worked (auto)
- Leave calendarLeave request records · calendar
- HR dashboardHeadcount · leave usage · late arrivals
EmployeesAttendanceLeaveDepartmentsFormula: hours = out − inEditApprove & buildDescribe the screen you want - STEP 02Excel import
Bring over your employee roster
Pick HR's employee spreadsheet in the Data Connection Tool and it becomes a database exactly as it was. No retyping 85 people.
datacraft.ai.krDataCraft AIAAdminCEOHome > HR management > EmployeesData Connection ToolImport fromExcel fileCSV fileFile Tables Rows employees_2026.xlsx 1 85 Result: Library › Imported dataImport - STEP 03Craft AI Biz Tools
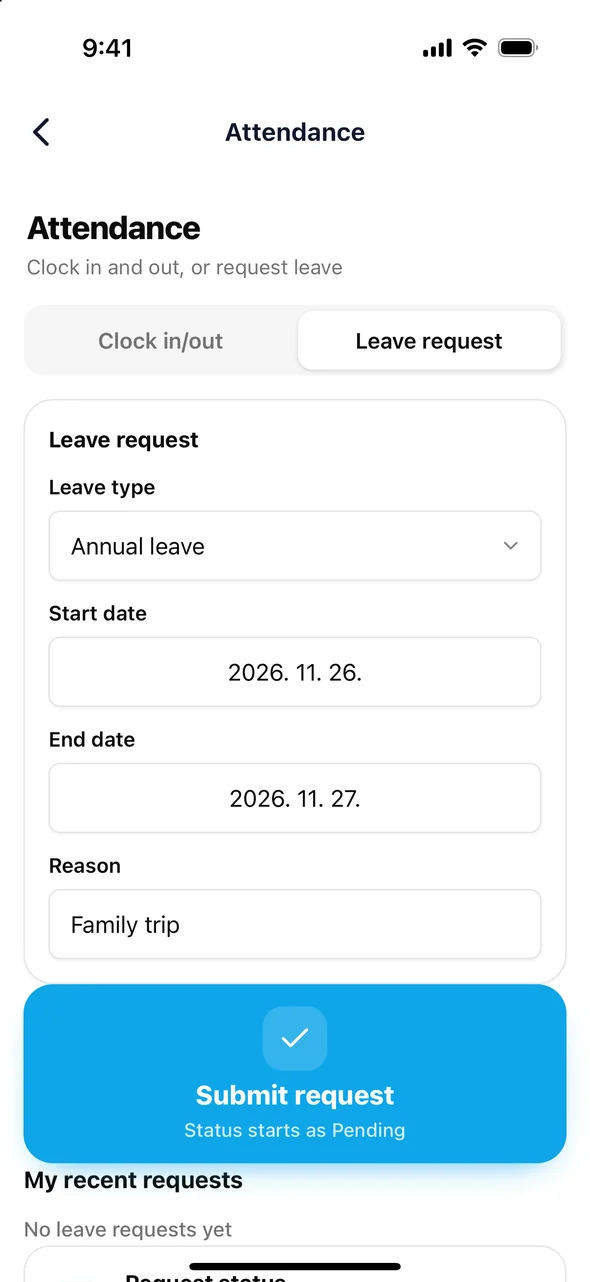
Attendance and leave requests from a phone
Employees tap clock-in and clock-out in the attendance tool in the DataCraft app. Entries are allowed only within 200 m of the office, and leave is requested from the same tool's leave tab.
- STEP 04Calendar
See who's off, and when
Leave requests made from phones appear on a calendar in color, so team leads can spot clashes ahead of time and adjust schedules.
datacraft.ai.krDataCraft AIAAdminCEOHome > HR management > Leave calendarLeave calendar
November 2026TodaySunMonTueWedThuFriSat123456Annual · Doyun789101112Half day · Seoa13Annual · Jiho14151617181920Annual · HarinHalf day · Woojin21222324Family · Soyul252627Annual · Doyun282930November 20, 20262 event(s)AddAnnual · HarinHalf day · Woojin - STEP 05Dashboard
Headcount and leave at a glance
Headcount by department, leave usage and late arrivals this month come together on a dashboard. Year-end leave reporting happens right here.
datacraft.ai.krDataCraft AIAAdminCEOHome > HR management > HR dashboardHR dashboard · November
Annual leave used064%100Headcount85Leave this month23Late this month4Headcount by departmentEngSalesPlanningDesignOpsEmployment type85- Full-time83.5%
- Contract10.6%
- Intern5.9%
- No more paper attendance sheets
- Leave requests and calendar in one place
- No separate year-end leave report
Build your own workflow today
Start with a sentence — your first screen is ready in five minutes.